Five independent, freely available data sources, fifty years of monthly and decadal records, and zero financial cost, assembled into a six layer regional climate study for Szabolcs-Szatmar-Bereg county in Hungary. The result lines up closely with the two most authoritative climate assessments Europe has produced, the EUCRA 2024 report and the ESOTC 2025 report, at county scale rather than continental scale. It was built by one curious person with no prior climate science background and an AI collaborator, across a series of sessions.
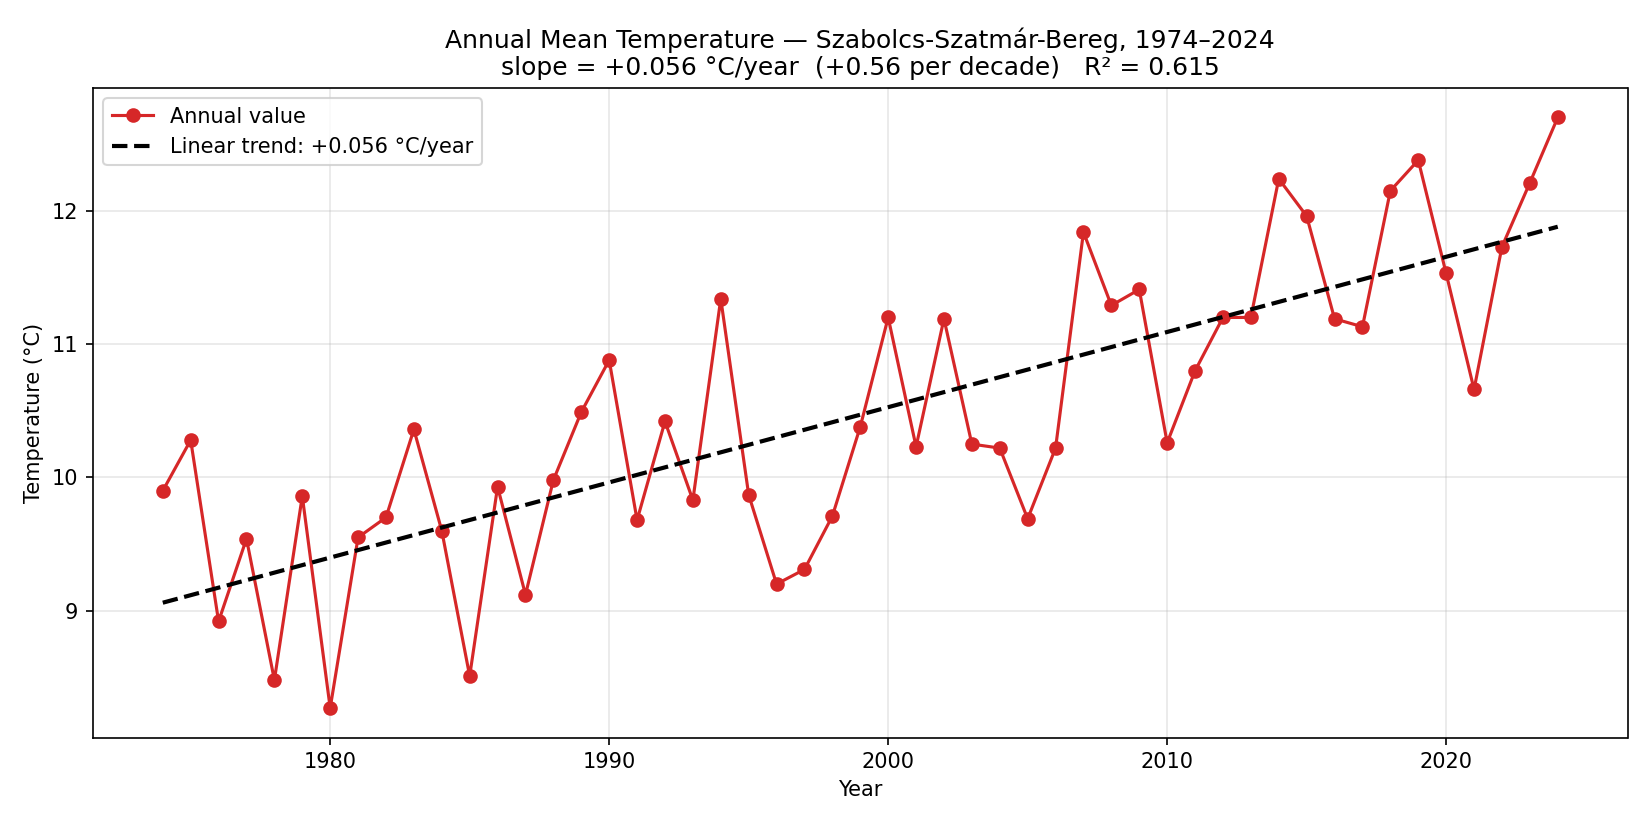
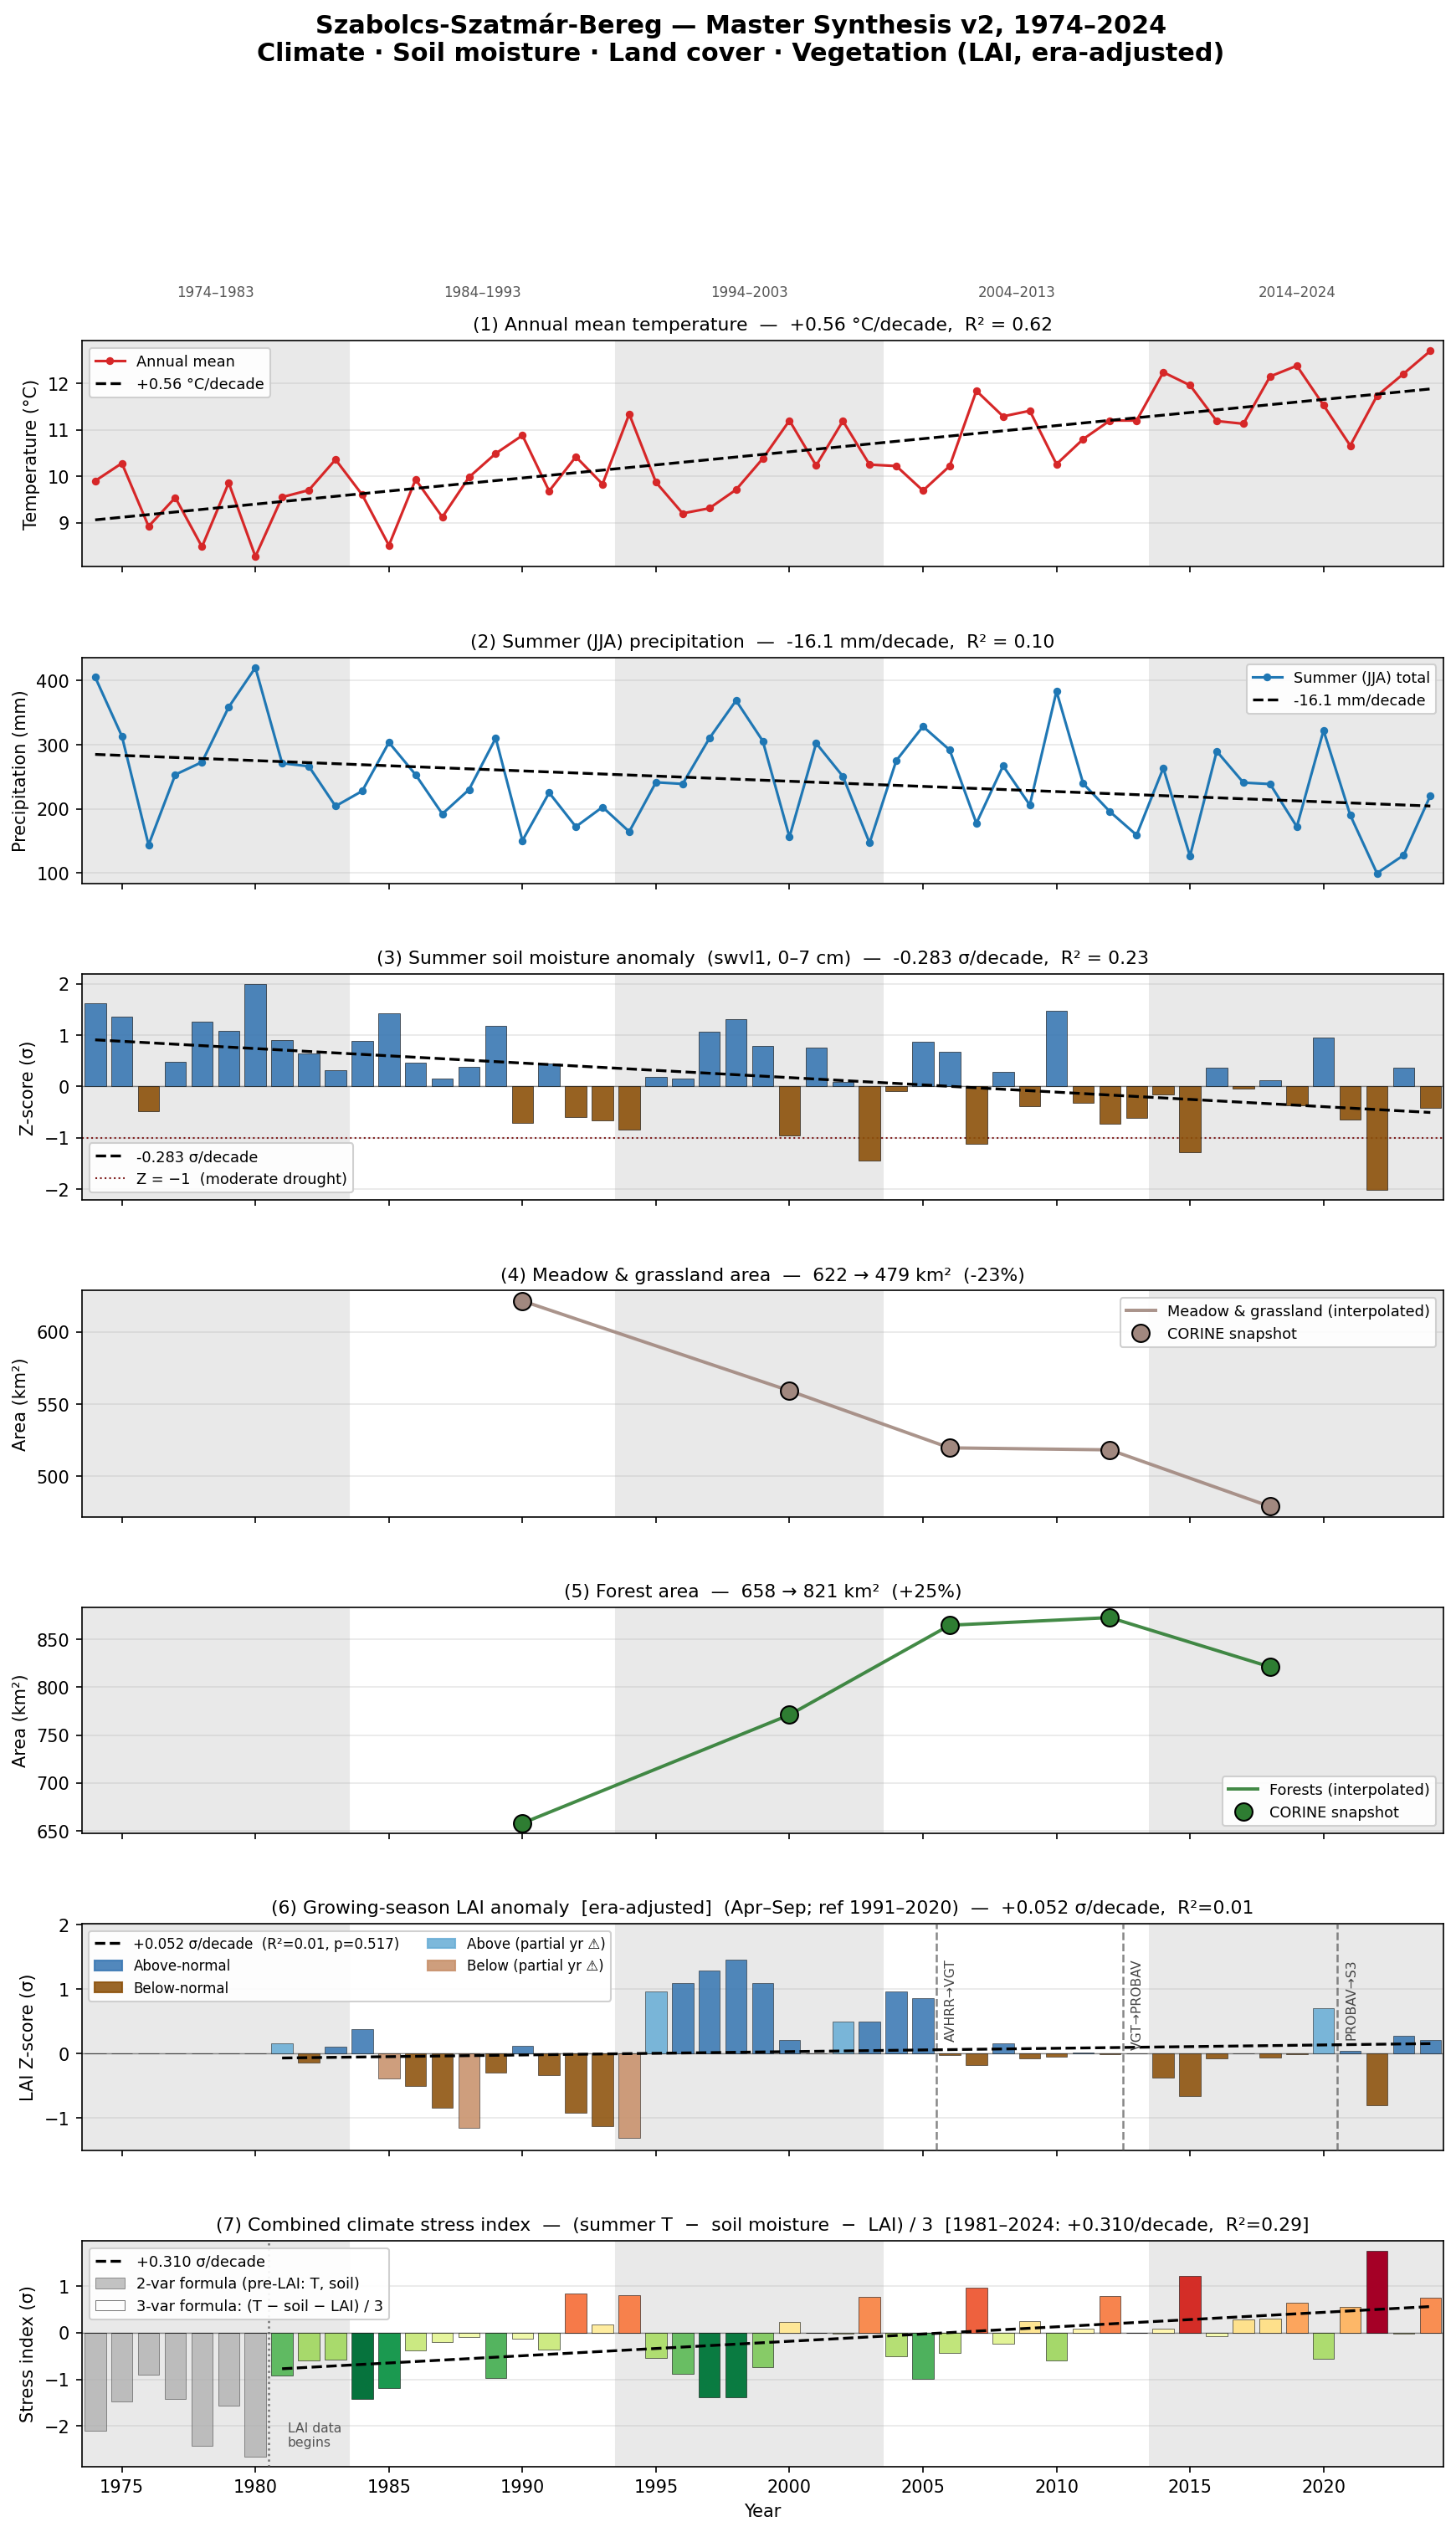
Annual mean temperature in the county has risen at 0.56 degrees Celsius per decade since 1974, a trend strong enough to explain 62 percent of the year to year variation on its own.
That rate matches the EUCRA 2024 benchmark for the Pannonian and Carpathian basin almost exactly, one of the fastest warming sub regions identified anywhere in the European Union.
Annual precipitation is falling too, but much more weakly and unevenly, about 30 millimetres less per decade, with an R squared of just 0.12. Rainfall in this county swings wildly from year to year, which matters for what comes next.
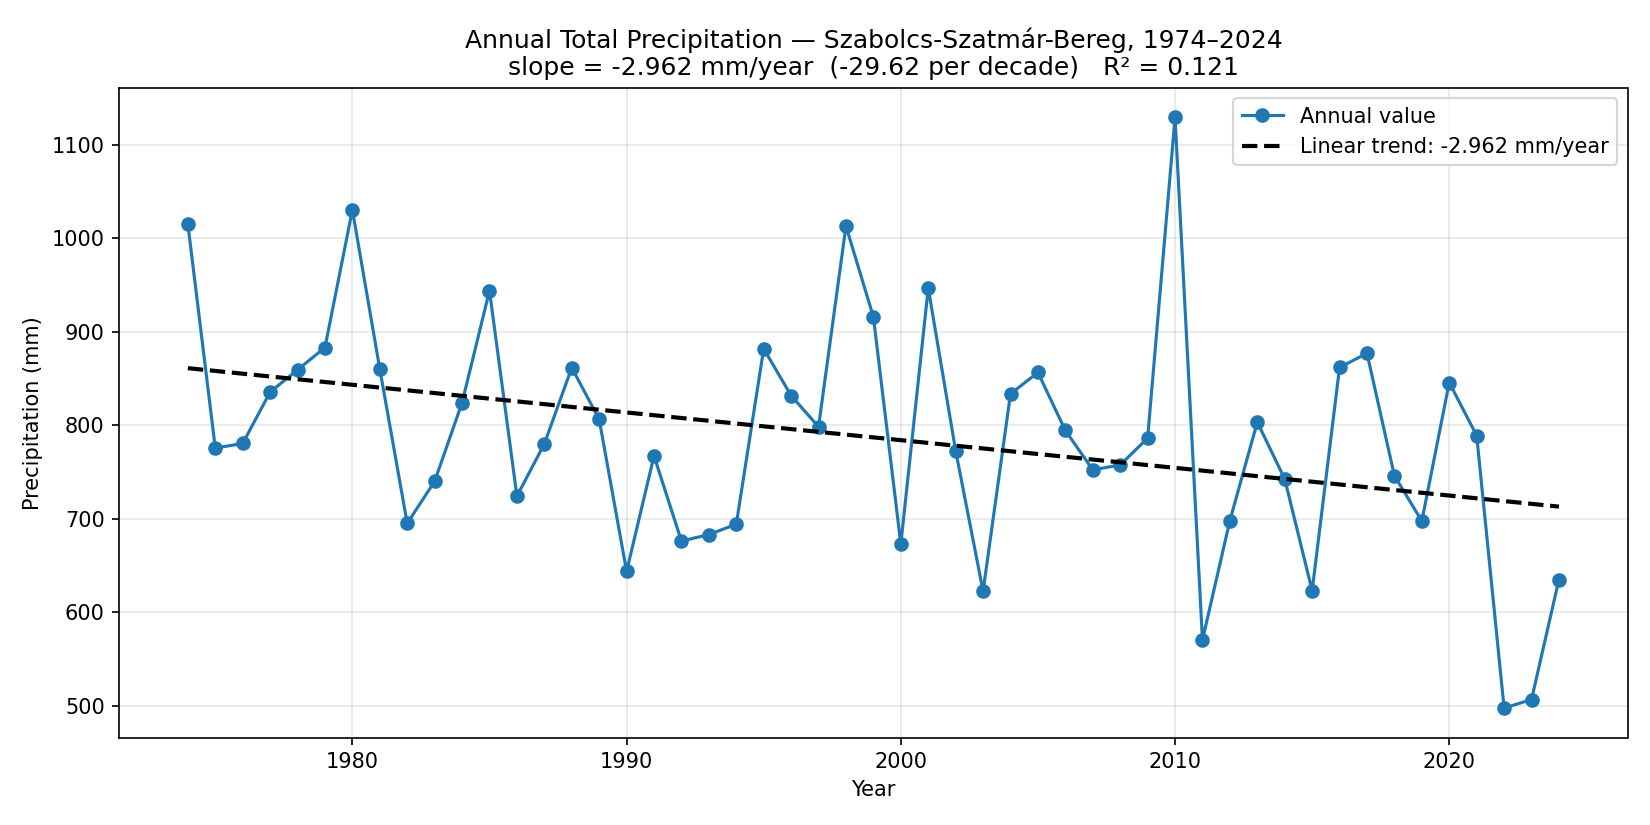
Temperature explains most of what is happening here. Precipitation is a much noisier signal, and taken alone, it would understate how much drier the land is actually becoming.
Soil moisture is where the two previous layers combine into something with real consequences. Summer soil moisture in the top layer has declined at a rate of 0.28 standard deviations per decade, a stronger signal than precipitation shows on its own, because soil moisture integrates both rising temperature, through evaporation, and the more erratic rainfall pattern.
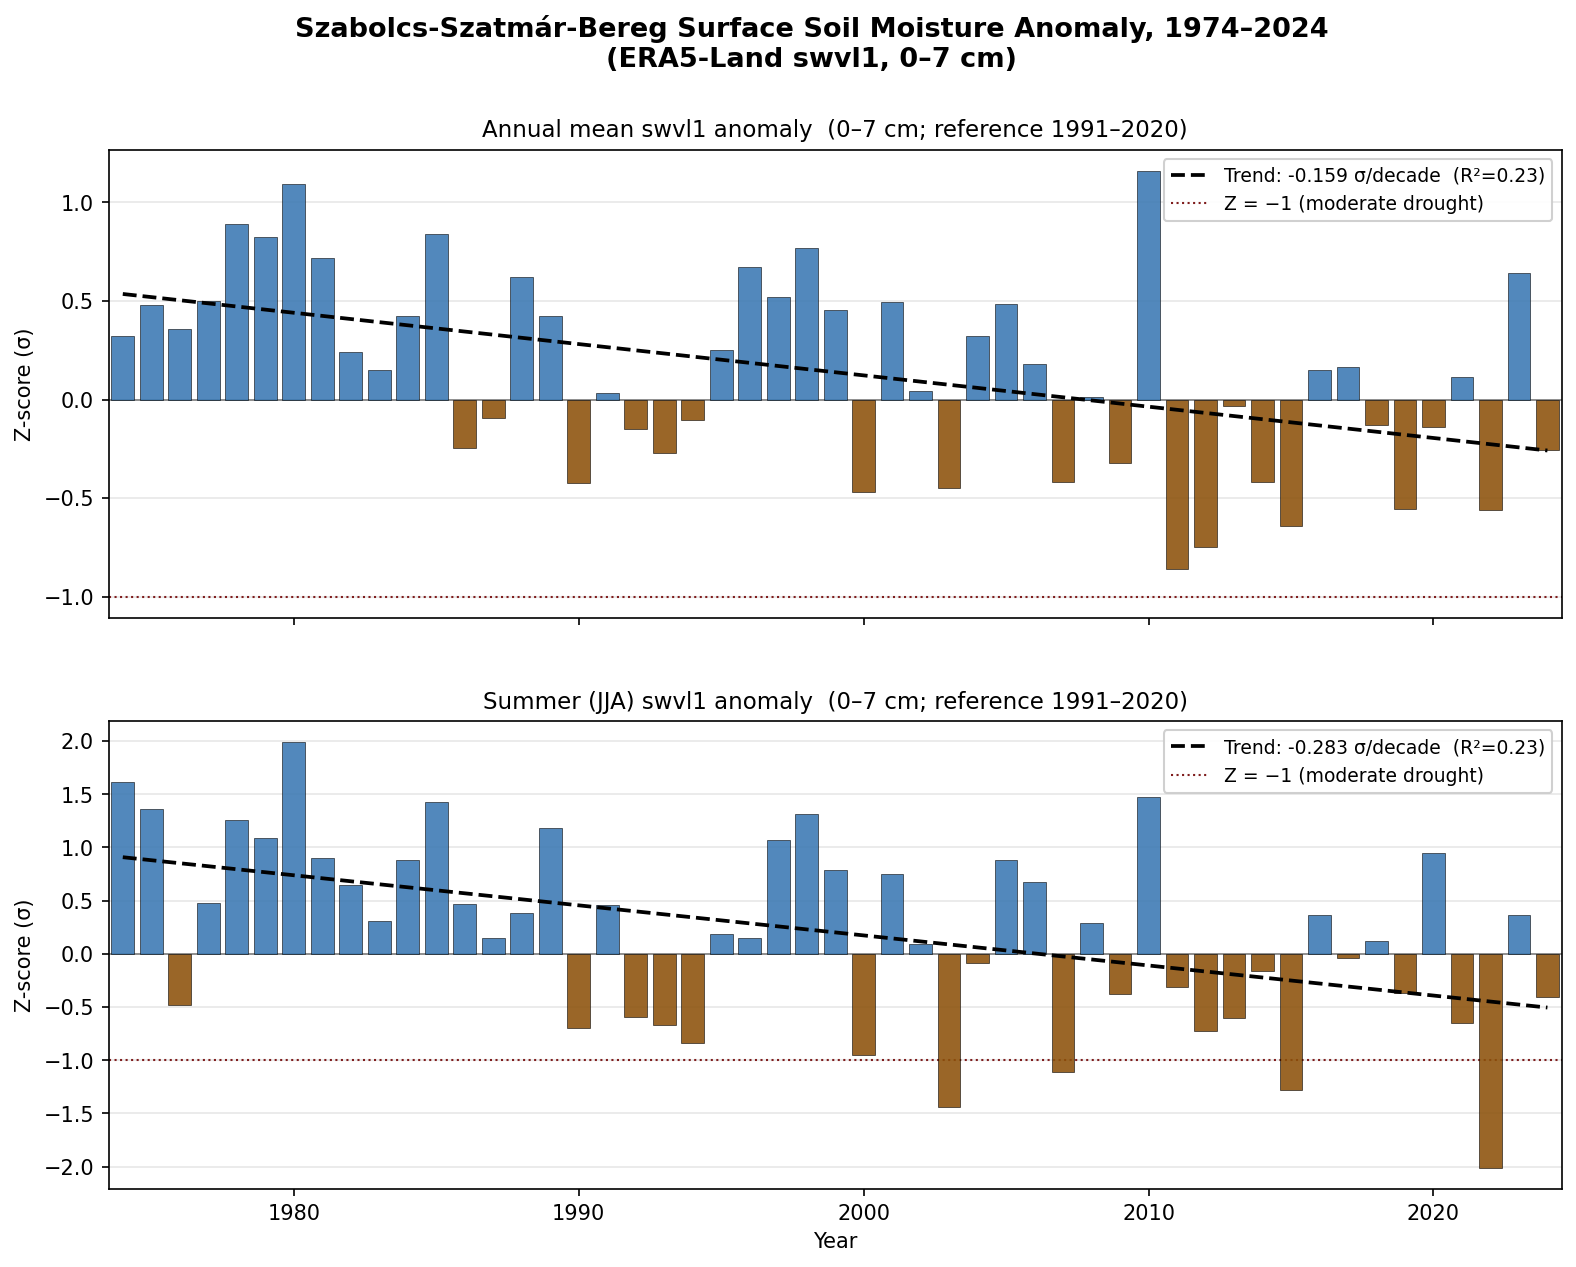
The summer of 2022 stands alone in this fifty year record: a soil moisture anomaly of minus 2.01 standard deviations, the single most extreme drought summer on record. The EUCRA 2024 independently identifies 2022 as the second lowest summer soil moisture value across the whole of Europe in the past fifty years, and attributes the long term drying mostly to rising evaporation driven by warming, with rainfall playing a smaller, secondary role. That is precisely what this county level data shows too.
Underneath the climate trend, the physical landscape has shifted substantially. Between 1990 and 2018, forest area grew by nearly 25 percent, while meadow and grassland area shrank by close to 23 percent, and agricultural land contracted by about 10 percent.
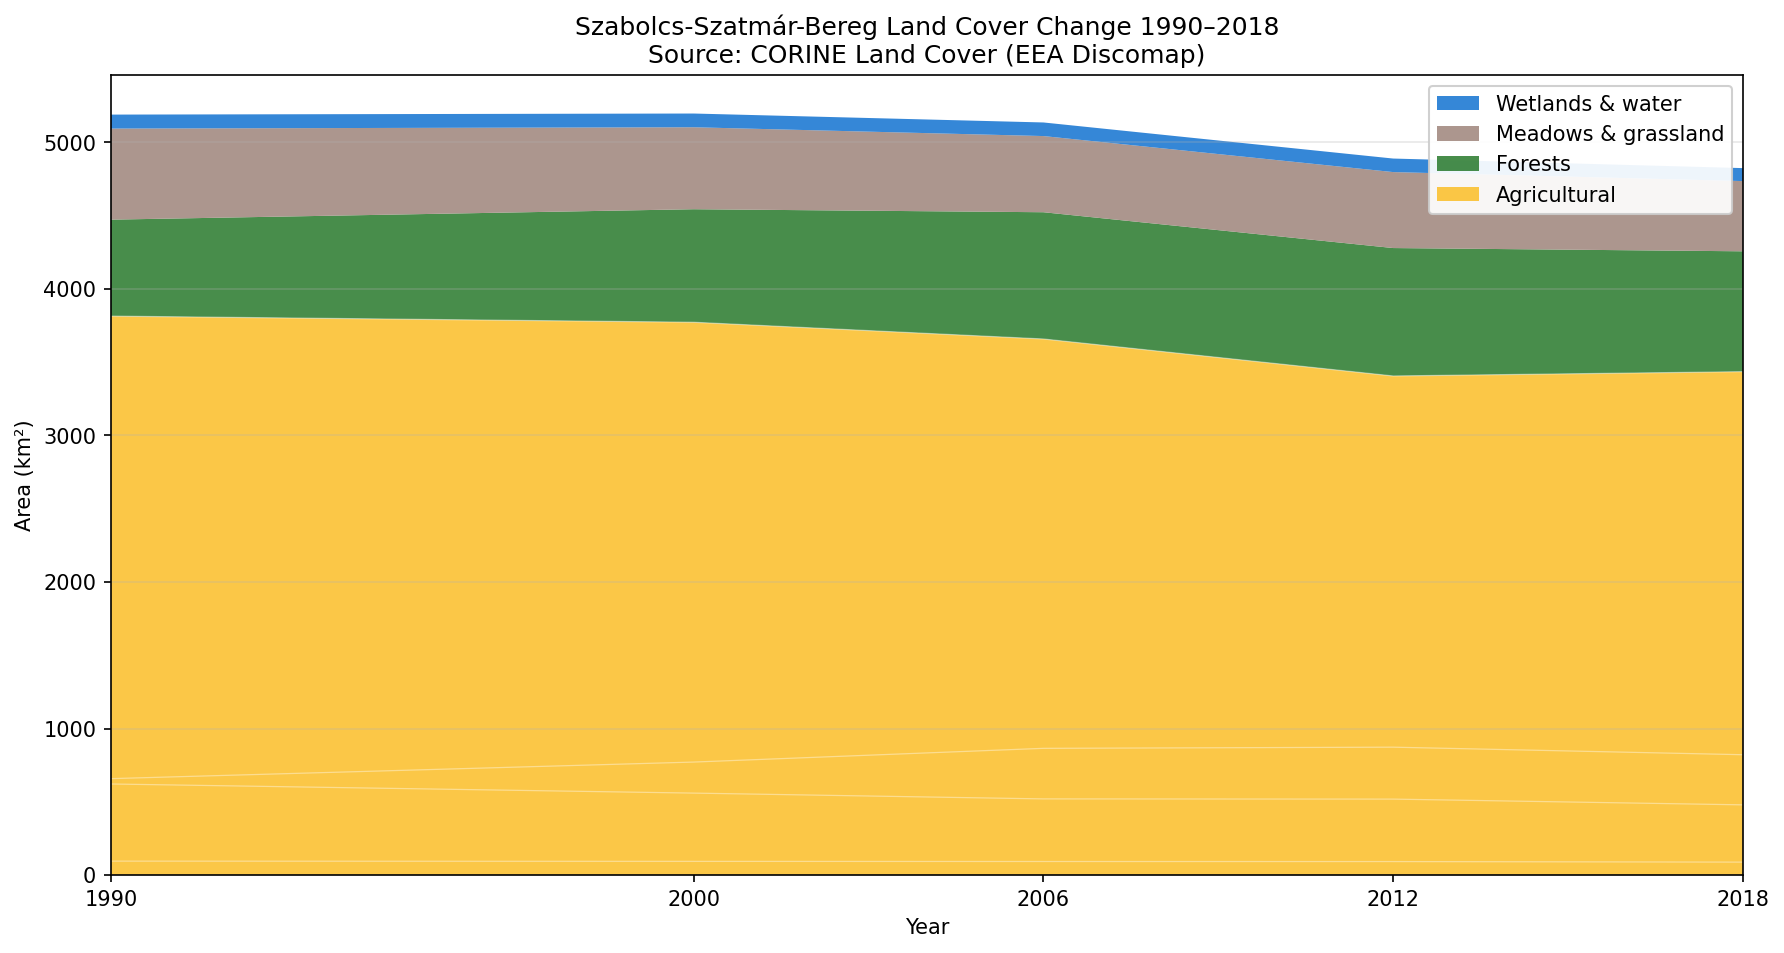
This runs counter to the general European pattern of drought exposed agricultural land expanding. The likely explanation is local afforestation policy, a human decision partially offsetting a climate trend, a detail a continent scale assessment would never surface.
The most interesting finding in the whole study came from a mistake almost made rather than a straightforward result. Vegetation health, measured through a forty year satellite record, appeared to show a striking greening trend in the most recent years. It did not survive scrutiny.
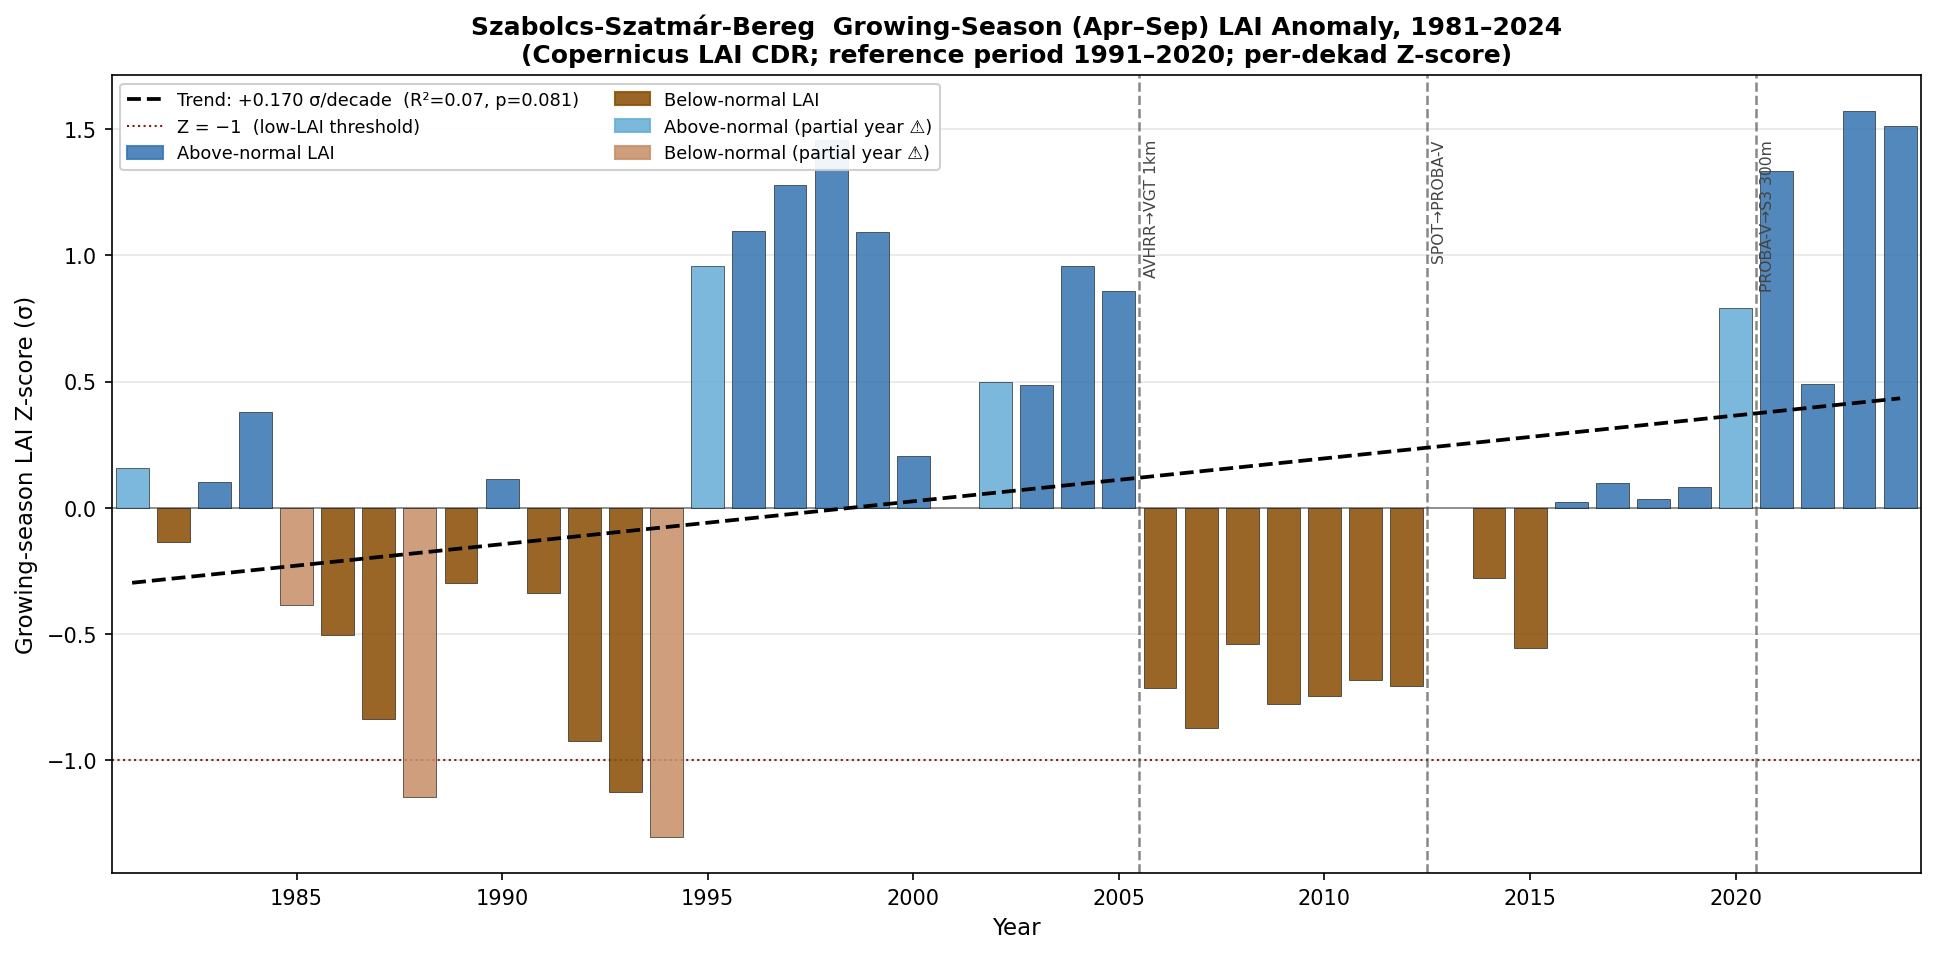
The vegetation satellite record was collected by three different sensor generations over four decades, each with a different resolution, and the newest one carried a systematic bias of plus 1.2 standard deviations relative to the earliest instrument. Once that instrument bias was identified and statistically removed, the apparent recent greening disappeared entirely, and 2022, the same year confirmed as the worst drought in the soil moisture record, dropped from a middling rank to dead last, the single worst vegetation stress year in the entire dataset. The uncorrected version of this chart would have told a genuinely false story.
A combined stress index, built from summer temperature, soil moisture, and the corrected vegetation signal together, trends upward at a rate that is statistically unambiguous, and every one of the five worst years it identifies since the year 2000 lines up with the exact compound heat and drought extremes the EUCRA 2024 describes as becoming more frequent across central and eastern Europe.
None of the five data sources used here cost anything. All of the analysis code is reproducible and version controlled. And the single most important step in the entire project was not running the numbers, it was catching an instrument artefact before trusting a conclusion built on it.
The ratio of output to input here is what careful, AI assisted analysis makes possible: a county scale climate study that independently confirms two of Europes